Invoice / Payment Amount Summary Chart
- Summary Chart helps to view payment and invoice detail graphically.
- ISP can view month-wise total invoice amount and total payment amount as a piece of summary chart information.
- Summary chart display information like a total invoice and total payment month-wise in graphically format.
- The chart is easy to understand rather than text.
Display Payment Amount Summary Chart
- To view a payment summary information,
- First of all Go to on sidebar menu click on Billing and select Summary option.

- The invoice Payment chart displays the month-wise total amount of payments and invoices.
- The chart displays the current year detail also we can change the year.
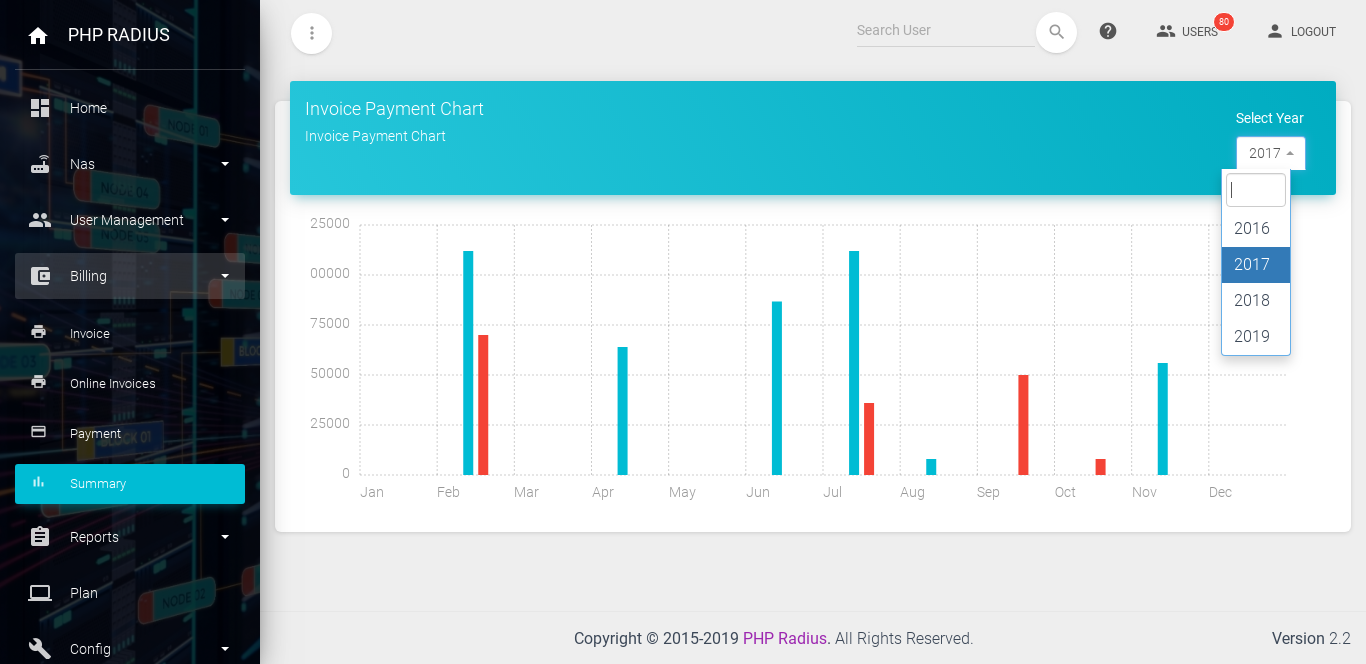
- if you want to see the previous year’s payment summary then select the previous year from the selection box.
- The red color plot gives you particular month-wise total payment information details.
- The blue color plot gives you particular month-wise total invoice information details.
- To view a particular monthly payment and invoice detail so move your mouse cursor on a chart so it will show a small tool-tip box for detail.
- By this chart, we can get information about total payment and invoice.